
Defined roughness and CD targets
The optimization needs numeric acceptance criteria—maximum LWR, CD tolerance, dose latitude—because the minimum acceptable dose is defined by them, not by the resist datasheet.
TECHNOLOGY / ELECTRON BEAM LITHOGRAPHY
Electron beam lithography writes with discrete electrons, so every pattern carries statistical fluctuations that no instrument upgrade removes. This guide explains how shot noise scales with dose, how to find the dose minimum that satisfies linewidth roughness and CD targets, and how dose optimization interacts with write time and resist.
Published

DIRECT ANSWER
Because an electron beam delivers charge in discrete electrons, the dose at any exposed pixel is a Poisson random variable: its relative fluctuation scales as the inverse square root of the mean electron count. Halving the dose doubles the relative noise. In resist, these fluctuations become linewidth and edge-position randomness—shot noise is the irreducible floor under linewidth roughness, visible as dose is lowered toward the sensitivity limit. The practical consequence: the minimum usable dose is set not by the resist's clearing threshold alone but by the roughness and CD-tolerance targets, which define how much relative noise the pattern can absorb.
Dose optimization is the process of finding that minimum with evidence. A dose matrix—identical patterns exposed across a range of doses, developed and measured for linewidth and roughness—maps the usable window between underexposure (features missing or noisy) and overexposure (proximity blooming, CD inflation). The working dose is chosen inside the window with margin, then refined with proximity effect correction for pattern-dependent variation. Every dose reduction shortens write time proportionally, so the optimization is really an economic trade: the highest noise the pattern tolerates, converted into the lowest dose the schedule can exploit.
ENGINEERING CONTEXT
Every electron beam lithography user meets the same wall from two directions. From the process side, linewidth roughness and CD scatter worsen as patterns shrink and doses drop—features written with a few thousand electrons per pixel carry percentage-level statistical fluctuations that appear in the SEM as ragged edges no resist chemistry fully removes. From the scheduling side, dose is time: raising dose to quiet the noise extends write time linearly, and on dense patterns the machine hours become the cost driver. Between the two sits an optimum that is pattern-, resist- and target-specific. Teams that set dose once, anecdotally, either pay in write time for noise margin they did not need or ship roughness that a modestly higher dose would have suppressed. The fix is a repeatable dose-optimization procedure with measured roughness data—not folklore.
Discuss your requirement ↗CRITICAL REQUIREMENTS
The optimization needs numeric acceptance criteria—maximum LWR, CD tolerance, dose latitude—because the minimum acceptable dose is defined by them, not by the resist datasheet.
Exposure of identical test patterns across a logarithmic dose range on the actual resist stack and substrate, with development held fixed, to map the usable window.
CD and LWR measurement by SEM or AFM on the dose matrix samples, with enough line samples per dose to separate systematic trend from statistical scatter.
Pattern-dependent dose modulation interacts with the base dose choice; PEC parameters should be applied when measuring the final window, or the result will not transfer to production patterns.
BUYER MATRIX
Give every shortlisted supplier the same process definition and request configuration-specific proof.
| Aspect | Low dose (near sensitivity limit) | Moderate dose (optimized window) | High dose (noise-quenched) |
|---|---|---|---|
| Shot noise floor | High—visible roughness, edge placement scatter | Within LWR and CD targets with margin | Minimal statistical contribution |
| Write time per area | Shortest | Schedule-feasible | Longest—linear in dose |
| Proximity and resist response | Underexposure risk, feature loss, tight process control | Familiar window; PEC behaves predictably | Bloom and CD inflation; larger correction burden |
| Typical use | Non-critical marks, alignment structures, quick tests | Production nanofabrication | Roughness-critical gratings, metrology structures |
An electron beam lithography system does not deliver a continuous dose; it delivers electrons, and the number of electrons landing in a given exposed region during its dwell time fluctuates statistically even for a perfectly stable beam. The arrivals follow Poisson statistics: if the mean count is N, the standard deviation is √N, and the relative fluctuation is 1/√N. Write with 10,000 electrons in a pixel and the dose carries roughly one percent relative noise; write with 625 and the noise is four percent. Halving the dose quadruples the relative variance—this steep scaling is why shot noise bites exactly where users most want relief, at low doses on fine features.
The resist converts dose fluctuation into geometry fluctuation. Around the clearing threshold, the dissolution rate depends steeply on dose, so a few percent of dose noise becomes edge-position noise on every feature. Because the fluctuations are random and spatially uncorrelated, they appear as linewidth roughness and edge-placement randomness that resist chemistry, beam stability and staging precision cannot remove. Backscattered secondary effects add a correlated component, but the Poisson floor is the part set purely by counting statistics.
The dose matrix is the standard instrument for the trade. Write the same test pattern—a layout containing the critical feature sizes, pitches and structures of the real work—across a range of doses spanning roughly a factor of two to four in logarithmic steps, holding resist stack, development and everything else fixed. Measure CD and LWR on each die with a stated method and enough samples per dose to see the trend. The result is a window: below it, features thin, roughen and vanish; above it, CDs inflate, dense patterns bridge through proximity, and the resolution degrades. The window's width is the dose latitude of the process.
Choose the working dose inside the window with margin from both edges—not at the clearing threshold and not at the first noisy point. The margin absorbs the variables a test matrix holds constant: resist batch variation, development drift, substrate backscatter differences between the test layout and production layouts. Two to five percent dose margin at each edge is a common working rule; tighter margins demand tighter process control, which is itself a cost.
Write time scales with the total charge delivered: doubling dose doubles dwell times and doubles machine hours for a fixed beam current. This is the economic face of shot noise. On a sparse test layout the difference between two candidate doses is minutes; on a dense production layout with millions of shapes it can be hours per wafer. The optimized working dose is therefore not the one that minimizes roughness in absolute terms—it is the highest noise the pattern's LWR and CD targets tolerate, because that yields the lowest acceptable dose and the shortest schedule.
The trade interacts with machine capability. A system with higher available beam current at the same spot size and resolution delivers the same electron count in less dwell time, which is one of the practical meanings of throughput in EBL specifications. But current cannot be raised indefinitely: at high beam current the spot grows and resolution suffers, so the dose–time–resolution triangle is closed at every point. The honest way through is per-layout: compute write time at the candidate doses on the real data, and let the roughness targets decide how much time the noise floor is worth.
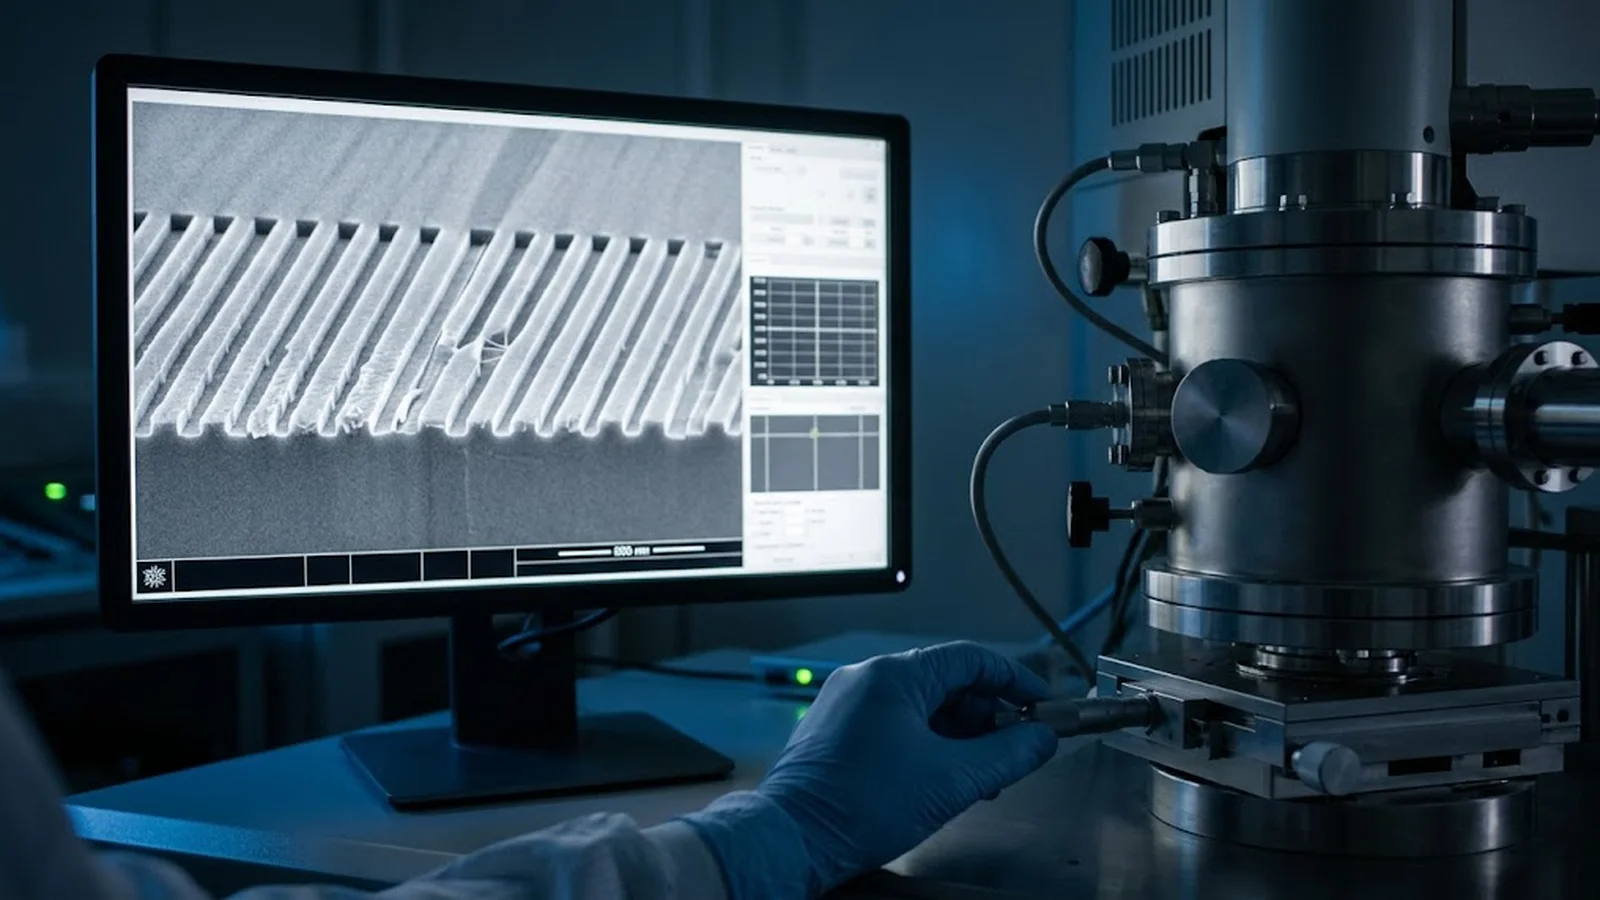
Shot noise sets the floor, but the dose actually assigned to each shape is modulated by proximity effect correction: dense regions need less dose per shape because neighboring exposures add deposited energy, isolated shapes need more. PEC therefore multiplies the base dose by pattern-dependent factors, and both the noise and the process window travel with the modulated dose. A working dose chosen from a matrix run without PEC will not transfer exactly to corrected production patterns—the right procedure measures the final window with the production PEC settings applied to the test layout, or at minimum verifies CD and roughness on the first corrected production write.
Charging effects on insulating substrates shift local deposited energy the same way, and temperature-sensitive resists drift between matrix and production if development differs by even a minute. The lesson generalizes: dose optimization is valid only for the exact stack and conditions it was measured on, and every later change—resist batch, developer, substrate, beam energy—reopens the question. Treat the dose matrix as a living artifact, re-run when inputs change, and archive the curves with the recipe so the working dose always has its evidence.
CONCLUSION
Shot noise is the statistical foundation under every electron beam written pattern: relative dose fluctuations scale as the inverse square root of electron count, and no instrument refinement removes them. What a process can control is where it operates relative to the floor—through a measured dose window, chosen with margin, and verified with roughness and CD metrology.
Because write time scales with dose, the optimization is economic: the correct working dose is the lowest one that keeps linewidth roughness and critical dimension inside their targets on the real resist stack, with proximity correction in the loop and the write time computed on the real layout. Run the matrix, keep the evidence, and re-run it whenever the stack changes—dose optimization is a procedure, not a setting.
EVIDENCE CHECKLIST
FAQ
Dose delivered by discrete electrons follows Poisson statistics, so relative dose fluctuation equals 1/√N for N electrons per exposed region. In resist, these fluctuations scatter edge positions and appear as linewidth roughness. As dose drops, the roughness floor rises; the minimum usable dose is where the roughness still meets the pattern's LWR target.
That depends on the tolerance. A one percent relative fluctuation needs about 10,000 electrons per feature element; a four percent tolerance needs about 625. The requirement is set by the CD tolerance and LWR spec divided by the resist's dose-to-geometry transfer sensitivity—compute it from the target, then confirm with the dose matrix.
Higher beam current delivers the same electron count in less dwell time, shortening write time at constant dose. But beam current is coupled to spot size and resolution in any column, so raising it trades away minimum feature size. The current-versus-resolution operating point is part of the same optimization as the dose itself.
Ideally yes for the final window: PEC modulates the dose each shape receives, shifting the effective noise and window. A practical compromise is to run the matrix without PEC to map the resist response, then verify CD and LWR on the first production write with PEC active, adjusting the base dose if needed.
Whenever a material input changes: resist batch or type, developer or bake recipe, substrate material, beam energy, or spot/current configuration. Each of these shifts the dose-to-geometry transfer, so the archived matrix curves should be updated with a fresh matrix before production patterns are written.
AUTHORITATIVE SOURCES
TECHNICAL REVIEW
Send the application, critical parameters and any drawing or process information available.
Discuss your application ↗