
Known projection optic parameters
Wavelength, numerical aperture or F-number, and the vendor's measured depth of focus for the process contrast target—not a datasheet figure alone—form the top of the budget.
TECHNOLOGY / LITHOGRAPHY OPTICS
Focus is a budget, not a setting. This guide explains how projection F-number sets the depth of field in a maskless lithography tool, how that depth is spent across substrate flatness, chuck topography, resist thickness and stage dynamics, and how to allocate and verify the remaining margin.
Published
DIRECT ANSWER
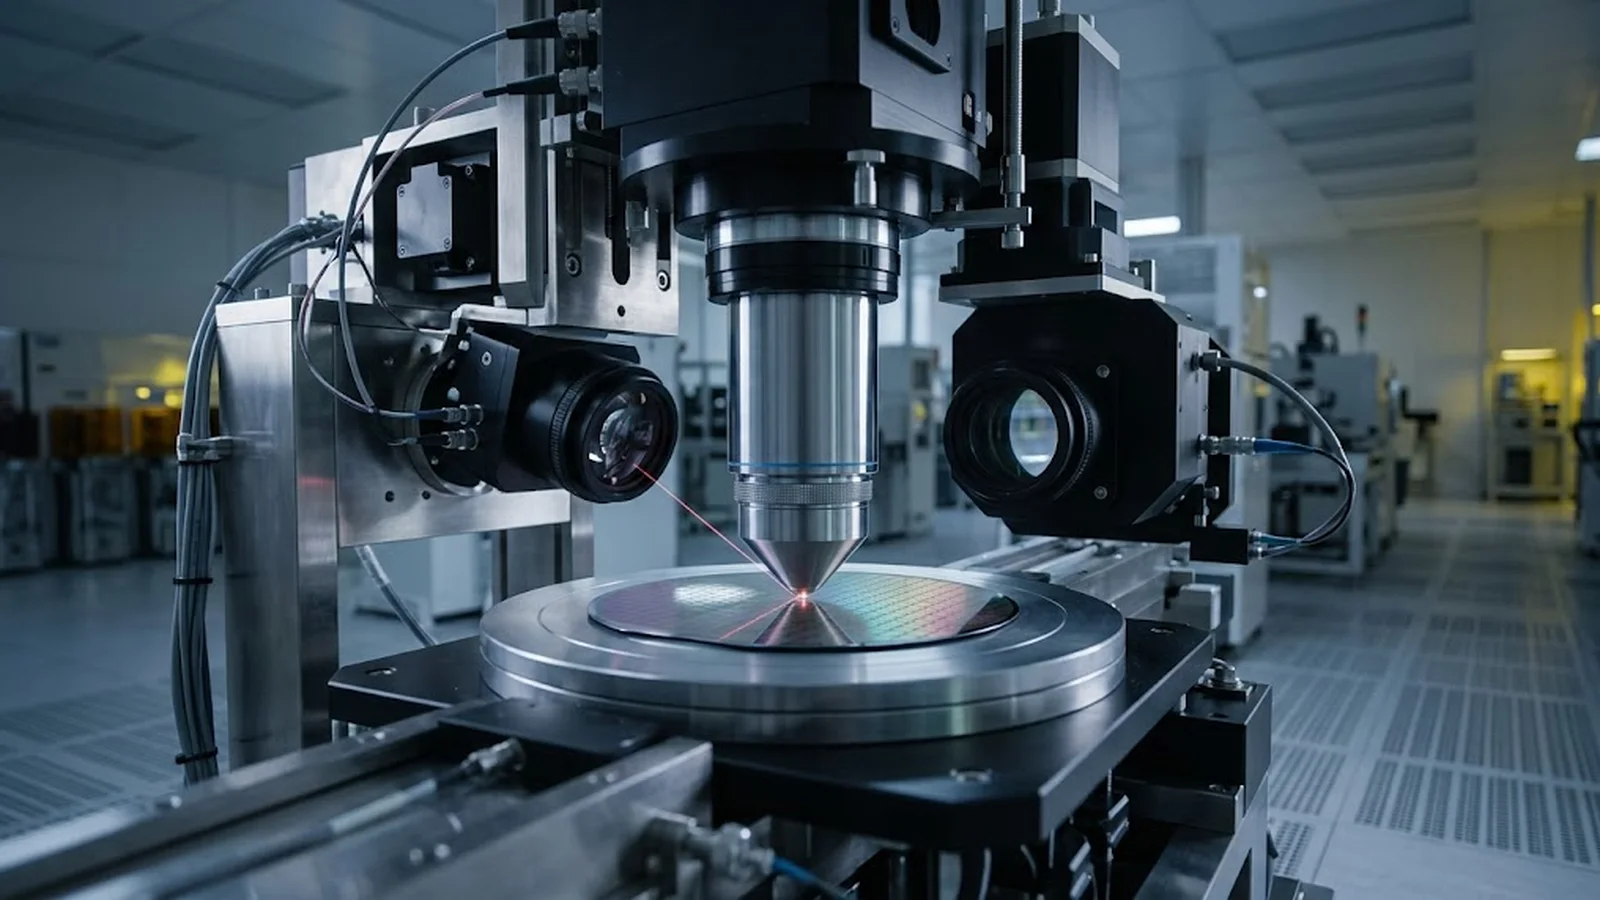
In a maskless lithography tool, usable focus is the projection optics' depth of field—approximately proportional to wavelength divided by numerical aperture squared—minus every other contributor to defocus across the field and across the substrate: substrate and chuck flatness, wafer bow, resist thickness variation, stage tilt and focus-sensor noise. The F-number (F/# = 1/(2·NA)) is the shorthand for this trade: a faster optic (lower F-number) concentrates the aerial image tighter and shrinks the usable depth, while a slower optic holds focus over a larger depth at the cost of resolution.
A practical focus budget allocates the total depth of focus across contributors with a root-sum-square or linear sum, leaving the remainder as process margin. If the sum of substrate topography, chuck error, resist variation and dynamic tilt approaches the total depth, linewidth control degrades before any component is 'broken'—the symptom is pattern-dependent CD drift across the wafer. Verifying the budget means mapping focus across the substrate, comparing the measured defocus map against the allocation, and confirming CD uniformity at the worst-case field positions.
ENGINEERING CONTEXT
Maskless lithography writes patterns point by point or pixel by pixel directly from data, so every field position depends on the optics staying in focus while the stage moves. The projection optics set a depth of field that is physically finite—often only a few micrometers at high numerical aperture—and the tool must spend it on an imperfect world: substrates that bow, chucks with micron-scale topography, resist that varies in thickness, and a stage that tilts dynamically as it accelerates. Teams that treat focus as a single Z setpoint discover the problem as CD variation that follows substrate topography or stage position, and then chase it through dose, resist and calibration when the root cause is geometric. The discipline that prevents this is an explicit focus budget: know the optics' depth of field, measure what the substrate and machine consume, and verify that what remains covers the process window.
Discuss your requirement ↗CRITICAL REQUIREMENTS
Wavelength, numerical aperture or F-number, and the vendor's measured depth of focus for the process contrast target—not a datasheet figure alone—form the top of the budget.
Flatness of the chuck and typical substrate bow, measured over the full write area, quantify the largest static defocus contributors.
A focus sensor with adequate noise floor and bandwidth, calibrated against the projection focal plane, keeps residual defocus within its allocated share.
Linewidth measurements at field edges, substrate high and low points, and scan extremes verify the budget against the observable outcome.
BUYER MATRIX
Give every shortlisted supplier the same process definition and request configuration-specific proof.
| Aspect | Fast optic (low F-number, high NA) | Moderate optic (mid F-number) | Slow optic (high F-number, low NA) |
|---|---|---|---|
| Resolution at same wavelength | Smallest features, tight aerial image | Intermediate feature size | Larger features, softer aerial image |
| Depth of field | Shallow—micron scale or less; budget dominates design | Usable depth with standard substrate quality | Deep—forgiving of topography and bow |
| Sensitivity to substrate flatness | High; chuck and wafer maps are mandatory | Moderate; flatness spec still required | Low; often within bare-substrate tolerances |
| Typical use in maskless tools | Fine-pitch photonics, MEMS, advanced prototyping | General maskless fabrication | Thick resist, PCB-level and packaging work |
The F-number of a projection optic is the ratio of focal length to entrance pupil diameter, and for lithography systems it maps directly to numerical aperture: F/# ≈ 1/(2·NA) in the symmetric-cone approximation used for lens selection. Every optical system focuses over a finite depth—move the substrate away from the focal plane and the aerial image blurs, first in contrast, then in edge slope, and finally in linewidth. Diffraction-limited theory puts the usable depth of focus at roughly k₂·λ/NA², where k₂ is a process-dependent constant typically between 0.5 and 1 for CD control targets. The inverse-square dependence on NA is the crux: doubling NA to gain resolution quarters the depth of field.
This is why F-number appears in lithography conversations as a shorthand for the resolution–depth trade. A low F-number (high NA) optic writes finer features but demands near-perfect geometry; a high F-number optic accepts wavy substrates but cannot write fine pitch. In a maskless tool the trade is fixed at design time, and what the process engineer controls is how the resulting depth of field is spent.
A focus budget starts from the measured depth of focus at the process target and subtracts, or root-sum-squares, every contributor. Static contributors dominate most budgets: chuck topography (vacuum chucks typically hold a few micrometers over a full wafer, better on small areas), substrate bow and waviness (silicon wafers are flat, but glass, ceramic and flexible substrates are not), and resist thickness variation. Each micron of topography at the focal plane is a micron of defocus. Machine contributors follow: stage tilt and roll across travel, autofocus sensor noise and bandwidth limits, and the calibration residual between the focus sensor's reference plane and the projection focal plane.
The allocation should state, for each line, how it was measured and whether it is systematic or random. Systematic defocus— chuck topography, substrate bow—can be mapped and compensated by the stage's Z motion using the focus map; random contributors cannot, and they consume margin everywhere. Tools that support per-field or per-substrate focus mapping convert the largest systematic lines into compensated quantities, leaving the residual budget to the random terms.
The end of the budget is process margin: how much defocus the resist system tolerates before CD drifts past its tolerance. A budget that sums to 90 percent of the depth of field has no margin, and every new substrate lot becomes a CD investigation.
The autofocus system is what makes the budget real during writing. Most maskless tools use a focus sensor—an optical probe beam separate from the projection path—referenced to the projection focal plane through calibration. Its two performance figures matter in the budget: noise floor, which sets the random defocus floor while writing, and bandwidth relative to stage dynamics, which determines whether the Z loop can follow topography and tilt at writing speed. A sensor with sub-100-nanometer noise and sufficient bandwidth leaves the bulk of the residual budget to substrate effects; a noisy or slow sensor quietly becomes the largest line in the budget.
Calibration discipline matters as much as sensor quality. The sensor's reference plane must be verified against the projection focal plane periodically—by writing a focus-wedge pattern, measuring CD versus Z, and confirming the peak lands at the sensor's zero—because a drift between the two planes appears as a constant bias that shifts every field identically and is easy to mistake for a resist or dose problem.
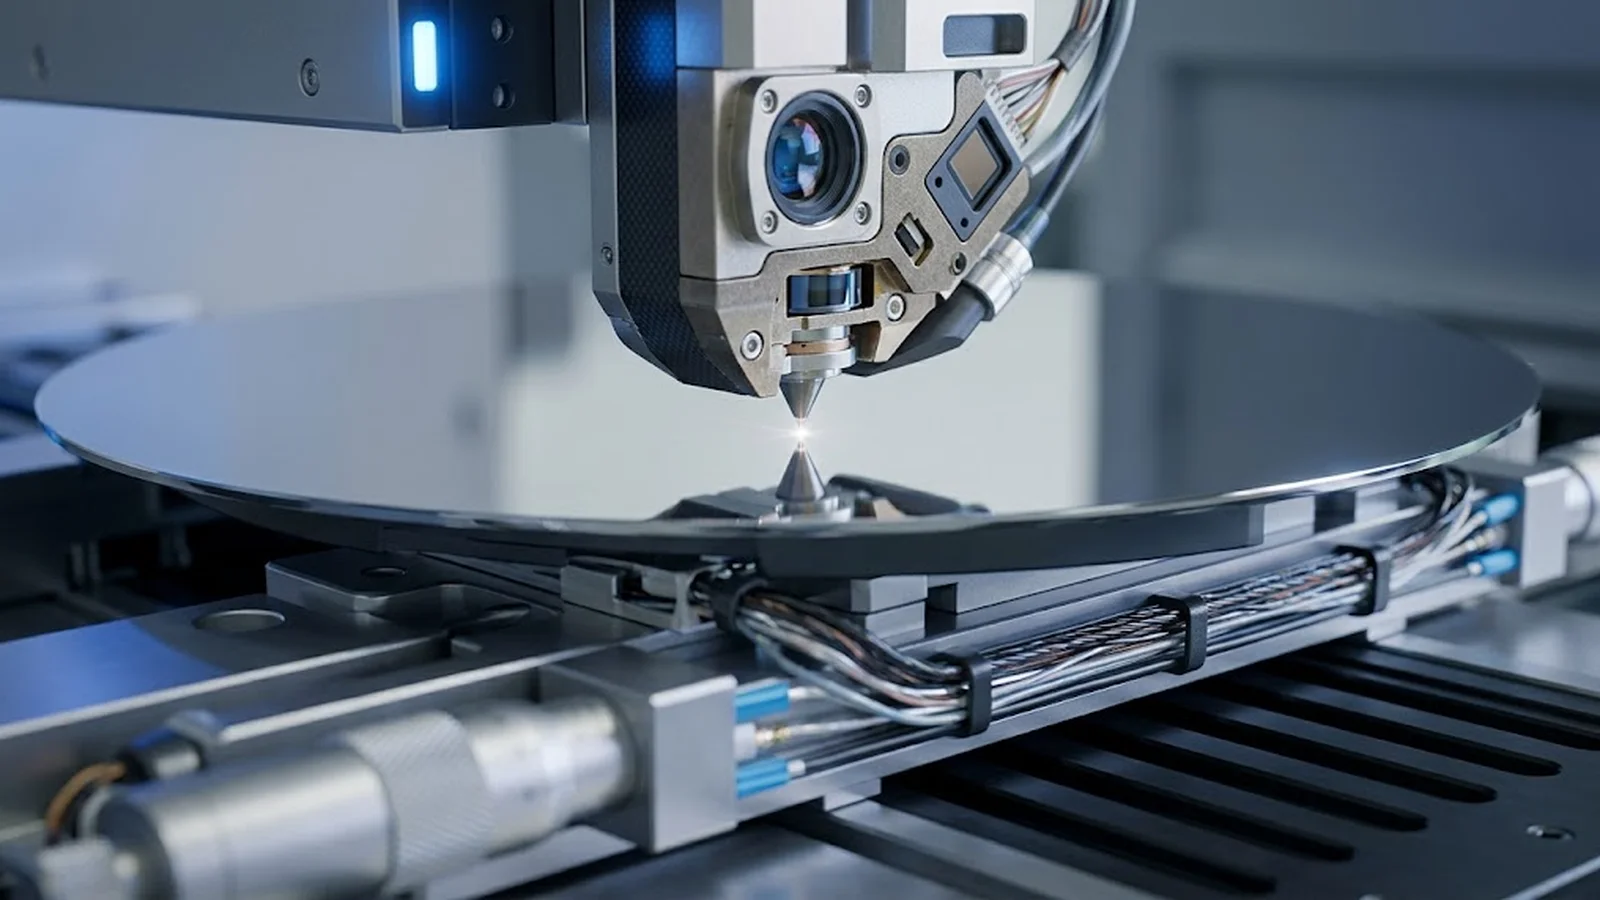
Verification closes the loop. Map defocus across the write area—many tools expose a focus-wedge or focus-probe pattern at a grid of field positions; CD versus nominal Z at each position yields the local best focus. Comparing the resulting map against the budget's static lines confirms whether chuck and substrate contributions are as measured and whether focus compensation is working. CD measurements at the worst-case positions—field corners, substrate high and low points, scan start and end—then verify that linewidth control holds where the budget is thinnest.
When the measured map exceeds the allocation, the diagnosis follows the budget lines in order: re-measure chuck topography if the map is stable and repeatable (a mechanical topography signature), check substrate handling and bow if the map follows the substrate, and inspect focus sensor calibration if the map shifts uniformly between sessions. Pattern-dependent CD drift that follows neither substrate nor stage usually points to dose or data-path issues rather than focus, which is why the defocus map should be captured before dose experiments begin.
The focus budget is a selection tool, not only a verification one. Before committing a substrate type to a maskless process, compare its flatness and bow statistics against the budget's static lines; before choosing a writing mode or objective, compare its depth of field against what the substrate stack leaves as margin. Laboratories writing on glass, ceramics or flexible films often find that a moderate-NA writing mode with a comfortable depth of field delivers better effective pattern quality than a fast mode that spends the whole budget chasing topography. The number that decides is not the smallest feature size in the datasheet—it is the smallest feature size that survives the actual substrate with margin to spare.
CONCLUSION
A maskless lithography tool's depth of field is a finite resource, set by wavelength and numerical aperture, and spent across chuck topography, substrate bow, resist variation, stage dynamics and sensor noise. Treating focus as a budget—with measured lines, allocated shares and verified margin—replaces pattern-dependent CD surprises with a controllable allocation.
The verification evidence is straightforward and repeatable: a defocus map across the substrate, CD at the worst-case positions, and a budget sheet that accounts for where every micron of depth went. Tools and processes that keep this discipline write uniform patterns on real substrates; those that do not write uniform patterns only on ideal ones.
SOLUTION ROUTES
EVIDENCE CHECKLIST
FAQ
A common approximation is DOF ≈ k₂·λ/NA², where λ is wavelength, NA is numerical aperture and k₂ is a process constant (roughly 0.5–1) chosen for the CD control target. In practice the vendor's measured depth of focus for your contrast criterion is the better top line for a budget, because resist process and aerial image contrast shift the usable depth.
For a well-corrected projection lens forming an image in air, the working F-number approximates 1/(2·NA), and lithography literature commonly uses the two interchangeably for this regime. Immersion or asymmetric systems deviate from the simple relation, which is why specifications state both.
Measure it on representative substrates rather than assuming a datasheet figure. Bow over the write area translates nearly one-to-one into defocus unless the tool compensates with focus mapping; flexible and glass substrates commonly contribute several micrometers, which can exceed the entire depth of field of a fast optic.
It removes the systematic part within its own performance limits: sensor noise adds a random residual, and bandwidth limits leave fast transients uncompensated. Mapped focus compensation plus autofocus handles chuck topography and substrate bow well; the budget should still carry the sensor's noise floor and calibration residual as active lines.
Focus errors produce position-dependent CD drift that correlates with substrate topography or field position, and CD changes even where dose would not predict them. Capture a defocus map first: if best-focus Z varies across the substrate by more than the allocated margin, the problem is geometric; if the map is flat but CD still drifts, investigate dose and resist.
AUTHORITATIVE SOURCES
TECHNICAL REVIEW
Send the application, critical parameters and any drawing or process information available.
Discuss your application ↗